In 1975 the National Academy of Sciences published the picture below that showed the temperature of the northern hemisphere. The picture shows roughly one degree of warming from 1885 to 1940 and also that essentially all warming had disappeared by 1970.

The temperature of the Northern hemisphere by the National Academy of Sciences 1975.
We know it was really cold in the Nordic countries 1860 – 1870 why? This is because we know that up to 20% of the population of areas in Sweden and Finland died in famine because crops failed for several years in a row. From Sweden it is reported:
The 1860-ies was a decade when crops failed in Norrland several times. The spring 1867 was extremely cold and the summer was late. There are many reports about how the winter didn’t want to loose its grip:
On may 22 at 11:30 am it was 1 deg C cold (-1) with the wind from NE. The markers on the lake (on the ice) are still standing upright and the depth of the snow is 1 1/2 aln (roughly 85 – 90 cm). May 25: Cold wind no melting and perfectly possible to move by sled, depth of snow 1 1/4 aln. On may 24 we run on ice frozen to land and no marker had melted off. On june 1: Run on the ice in a sled, good driving. On june 17 the lake was free of ice and in the evening a strong storm arose with lots of rain. June 19: Let out the cows. Snow still in the woods, no leafs on trees, no leafs on blueberry bushes no grass. (Noted by Zakarias Wallmark in Burträsk)
The harbour in Sundsvall in the 1870-ies: Neither sailing ships or steamers were able to negotiate the ice. Not until midsummer 1867 it was possible to sow in the area of Burträsk (where Zakarias Wallmark lived) och the situation was similar in other parts of Norrland.
The temperature curve above shows that still in the middle of the 1880-ies was very cold on the northern hemisphere. The Temperature now started to rise and in the beginning of 1920-ies it was possible to read essentially the same as we read in the news papers today:
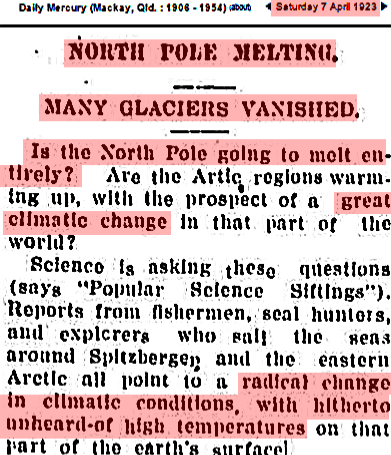
There are reports that the polar ice is melting and speculations that the ice could vanish altogether. Glaciers are melting fast.
After the temperature peak in 1940 the temperature started to go down again and in the early 1970-ies the whole warming from the beginning of the century had disappeared. The news papers now wrote about the cold and the risk of a new ice age.

At the end of the 1970-ies the cooling stopped and the new warming become a part of the politics. Note by the way that meteorologists say that a period of at least 30 years is needed to draw any valid conclusions regarding climate. The period cooling from the 1940-ies to 1970 is thus an indication of a possible shift from a warming climate to a cooling climate (20 – 30 years). Only ten years after the cooling ended the marketing of a warming catastrophe was started.
Why the establishment suddenly did a 180 degree turn is easy to see by reading for example what the club of Rome was discussing. In the first part of the 1970-ies the worrying population growth was discussed based on ideas of Malthus. After WWII much psychological research had been done regarding controlling the behaviour of mobs (large groups of people) had been done. The club of Rome had, after thorough internal negotiations, found that ”weather”, o how British, could be used as a tool for influencing the population of the west.
At the end of the 1980-ies Gro Harlem Bruntland presented the idea of ”sustainable development” and roughly at the same time James Hansen of GISS presented the risk of global warming only ten years after the cooling scare ended by intentionally selecting the statistically hottest day of the summer. Before his thesis was presented to decision makers the air conditioning was shut down to allow the politicians to really feel the heat …
The climate establishment is controlled by the WMO (World Meteorological Institute) under UN (United Nations) and most national meteorological organizations are close coupled to the WMO. A small group of people within the WMO and other top organizations in the hierarchy have been able to control who is allowed to publish and also what is allowed to be published. I recommend the interested reader to Google ”Climate Gate” in different permutations to look at e-mails from the inner circle among other things talking about eliminating the warm period of the 1930-ies … a few years later the warm period had disappeared through corrections. The same set of leaked e-mails also showed how the clique conspired to force editors in important scientific magazines not willing to follow orders to resign … this was also successful in some cases.
As briefly mentioned above the e-post messages shows how the ”task group” discussed how to eliminate the high temperatures in the 1930-ies. The marketing of the warming couldn’t be effective if it was possible to show that only half a century ago the temperatures were as high as today. The solution was to start correcting the measurements. The corrections were made by making old temperatures colder because changing today’s temperatures upwards wasn’t feasible … too easy to see through. The corrections were done as a series of corrections over a number of years. The adjustments have now almost eliminated the warm period of the 1930-ies just what the leaked mail discussed … an interesting random chance? Are the previous adjustments really done so incompetently that new adjustments that always cool the past are needed annually or semiannually.
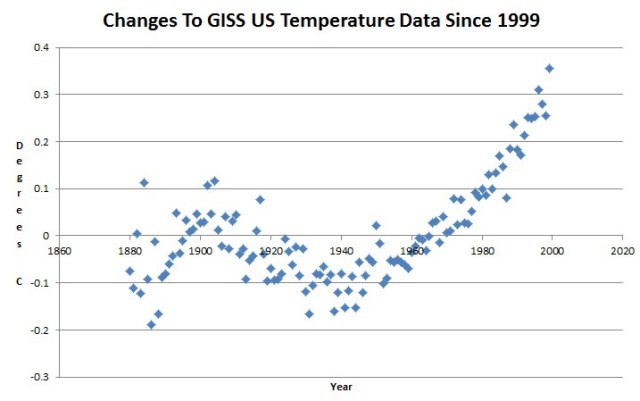
An example of GISS adjustments to temperatures. In this case it is US temperatures since the latter part of the nineteenth century (1880 – 2000).
Notice how the temperature adjustments are 0.5 – 0.6 deg C which is a significant part of the total global warming since the 1880-ies. How was the correction curve created? Very easy: The original raw data is available on the net. What is needed is simply a subtraction of the raw data from the the GISS temperature estimate. The difference is the magnitude of GISS adjustments. Any reader can check this fairly easily if he/she wants to do the effort. It could also be an interesting effort for anybody to check for example the mean temperature of one year as read from a meteorological year book in one’s own country and compare this data point against the same year as presented by GISS (you find nice web sites where GISS presents its temperature estimates). Not all stations are adjusted yet. I have personally annually checked two stations Sodankylä and Helsinki in Finland but so far there hasn’t been any major changes.

The temperature as measured by the Islandic Meteorological institute. According to the local Meteorologists all necessary adjustments have been applied.
The picture above clearly shows the warm period in the 1930-ies followed by a very deep cooling to roughly 1980.

The same meteorologic station (Reykjavik) after being massacred by GISS.
Notice how the warm period of the 1930-ies has disappeared almost completely. The Meteorological institute of Island notes:“The GHCN ”corrections” are grossly in error in the case of Reykjavik”.
The same kind of ”adjustments” can today be found all over the world. The same kind of adjustments have been done in Australia where the matter has been brought to justice … so far without results. No valid explanations for the adjustments have been given.
What have these ”Orwellian corrections” brought? One result is of course that official global temperature estimates show a steeply rising temperature curve that closely follows the meme of CO2/temperature. One funny thing few will notice is that the result of the corrections is a number of funny conflicts. The heading of this article is ”Ice melts when it is warm … or how did it go?”. When we today compare historic reports about melting/high temperatures and cooling/freezing we will notice funny conflicts.
In the first half of the 1920-ies one could read that glaciers and the polar ice were melting fast.
In the beginning of the 1970-ies one could read that the polar ice was advancing and glaciers were starting to advance again.

Global temperature according to GISS per june 27 2015. Compare how ”corrections have changed to form of the curve completely.
The original estimate by the National Academy of Sciences in 1975 was:
Notice how adjustments almost completely erased the warm period in the 1930-ies just as requested.
How does this work logically? According to GISS , read the curve, the temperatures in the 1970-ies were higher than in the 1920-ies. We know based on news reports from the 1920-ies that there was a fast melting up til perhaps 1950. After this melting period the ice was growing again.
The corrected temperature estimates of GISS thus says according to their own curve:
Glaciers and the polar ice will melt when the global temperature is low and the melting will stop when the temperature is high.
According to GISS the global temperature in the 1920-ies was ca. 0.3 deg C lower when ice was melting fast than in the 1970-ies when it according to GISS was warm and polar ices and glaciers were advancing.
Unfortunately I don’t buy this. Either the historical reports from the 1920 – 1950 are wrong or GISS corrections are wrong. I tend to believe the historical reports especially as the raw data doesn’t show this funny conflict.
Ordinary ”peasant’s logic” tells us that ice melts when it is warm and freezes when it is cold. On the other hand I know that we live in an interesting time … perhaps George Orwell was correct!
Etiketter: URI discussion

Lämna en kommentar