Den klassiska programmeraren som sitter och skriver, dricker ohälsosam CocaCola, läser/googlar och själv skriver varje rad kod är antagligen död eller håller på att försöka ta sina sista andetag.
I artikeln Moores lag beskrev jag en liten mikrokontroller som jag använde till att avläsa en koldioxidsensor och logga data till ett SD-minne kopplat till mikrokontrollern. Mikrokontrollern har en extremt liten bilskärm som man nästan behöver förstoringsglas för att läsa. För att göra CO2-loggern enkel att använda behöver jag ett program som kör på min laptop och som visar loggad CO2 koncentration, tillåter mig att skicka kommandon till mikrokontrollern etc.
Det finns många alternativ jag kan använda. Det första alternativet som för mig kändes väldigt naturligt skulle vara att använda Lazarus/Pascal som erbjuder ett trevligt grafiskt användarinterface som jag har använt ett antal gånger genom åren. Andra alternativ finns naturligtvis. Med lämpliga biblioterk kunde jag skriva ett grafiskt program i språket C eller i C++ men jag har inte kodat användarinterface i dessa språk vilket skulle betyda en hel del goolande och läsande.
Av en slump stötte jag på ett intressant verktyg baserat på öppen källkod: Processing. Processing bygger på Java men detta ursprung syns egentligen inte utan Processing påminner om Arduino IDE som jag känner väl från tidigare. Det största problemet med ett nytt verktyg som t.ex. Processing är att läsa sig in på vad det egentligen gör och hur det används samt ofta ny terminologi som grumlar till de första timmarna då man försöker förstå dokumentationen som plötsligt talar ett främmande språk.
Min medhjälpare AI
Jag beslöt att i stället för att sätta igång och koda i Processing så låter jag AI göra jobbet genom att ange vad jag vill ha gjort.
Mikrokontrollern ESP32-C3_OLED är kopplad till min PC över en serielinje som kör på 115200 baud. Loggade värden skrivs ut till serieporten med 5s intervall och med 15 minuters intervall loggas data till ett SD-minne på mikrokontrollern. Jag vill ha en applikation som körs på min Linux PC som i grafisk form visar inkommande data, tillåter mig att starta, stoppa och radera mätningar samt i grafisk form kontinuerligt visa CO2 trenden d.v.s. hur CO2 koncentrationen ökar/minskar.
Min diskussion med AI löpte på följande sätt:
Programmeraren (alltså jag):
Can you write me a Processing sketch that reads serial data from Arduino and writes the serial data to a window on the PC?
AI respons:
Here is a Processing sketch that reads serial data from an Arduino and displays it live in a graphical window on your PC.
import processing.serial.*;Serial myPort; // Create object from Serial classString inString = ""; // Input string from serial portPFont f; // Font for displaying textvoid setup() { size(600, 400); // Window size (width, height) // Print a list of available serial ports to the console to help find the correct one printArray(Serial.list()); // Open the port your Arduino is connected to. // Change [0] to match your Arduino's index in the list if needed! String portName = Serial.list()[0]; myPort = new Serial(this, portName, 9600); // Read bytes until a newline character ('\n') is received myPort.bufferUntil('\n'); // Create a simple font for the text display f = createFont("Arial", 16, true); textFont(f);}void draw() { background(40); // Dark gray background fill(255); // White text color textSize(18); // Title on the window text("Arduino Serial Data Monitor", 20, 30); // Display the latest received string on the window textSize(24); fill(0, 255, 128); // Neon green text for data text(inString, 20, 100);}// This function runs automatically when new serial data ends with a newline ('\n')void serialEvent(Serial myPort) { inString = myPort.readStringUntil('\n'); if (inString != null) { inString = trim(inString); // Remove whitespace and extra newlines }}
Resultatet blev ett enkelt grafiskt fönster nedan.
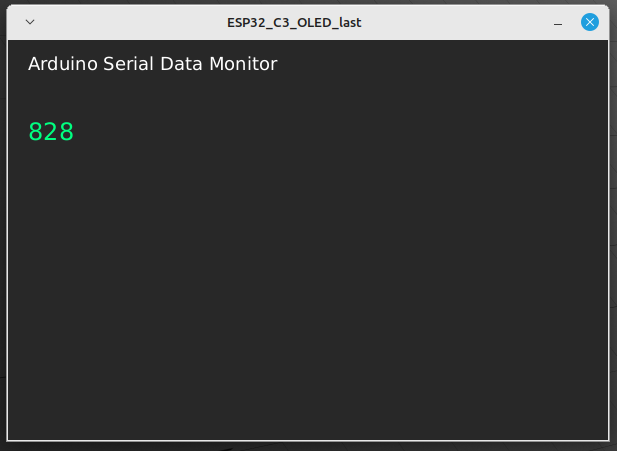
Fig. 1 Resultatet av det första försöket. Inte mycket att hänga i julgranen men programmet visar ett fönster på PC-skärmen, sätter upp seriekommunikationen korrekt och skriver ut ett mätvärde i taget helt enligt vad jag bad om.
Appen saknar helt möjligheter att från PC:n skicka textkommandon till mikrokontrollern. Saken kan fixas genom att be AI förbättra koden.
Programmeraren:
Add a field to input commands to send to the running Arduino app.
AI:
To add an input field for sending commands back to the Arduino, you can use Processing’s built-in keyPressed() function to capture typing and send the string over the serial port when you press Enter.
Here is the updated Processing sketch with a visual input box and keyboard text capture:
import processing.serial.*;Serial myPort; // Create object from Serial classString inString = ""; // Input string from serial portString outString = ""; // Text being typed to send to ArduinoString lastSent = ""; // Remembers the last command sentPFont f; // Font for displaying textvoid setup() { size(600, 400); // Window size (width, height) // Print list of available serial ports to the console printArray(Serial.list()); // Open the port your Arduino is connected to String portName = Serial.list()[0]; // Change '0' if your Arduino is at a different index myPort = new Serial(this, portName, 9600); // Read bytes until a newline character ('\n') is received myPort.bufferUntil('\n'); f = createFont("Arial", 16, true); textFont(f);}void draw() { background(40); // Dark gray background // SECTION 1: Display Incoming Data fill(255); textSize(16); text("Incoming From Arduino:", 30, 40); fill(0, 255, 128); // Neon green for incoming data textSize(24); text(inString, 30, 80); // SECTION 2: Input Field for Outgoing Commands stroke(100); fill(60); rect(30, 180, 540, 45, 5); // Draw the text input box fill(255); textSize(14); text("Type command and press ENTER to send:", 30, 165); // Display the text currently being typed inside the box fill(255, 255, 0); // Yellow text for typing textSize(18); text(outString + (frameCount % 30 < 15 ? "|" : ""), 40, 210); // Adds a blinking cursor // SECTION 3: Confirmation of last sent command if (!lastSent.equals("")) { fill(180); textSize(14); text("Last sent command: \"" + lastSent + "\"", 30, 260); }}// Captures keyboard input for the command boxvoid keyPressed() { if (key == ENTER || key == RETURN) { // Send the typed string to the Arduino, adding a newline character myPort.write(outString + "\n"); lastSent = outString; // Save to display on screen outString = ""; // Clear the input field for the next command } else if (key == BACKSPACE) { // Remove the last character if backspace is pressed if (outString.length() > 0) { outString = outString.substring(0, outString.length() - 1); } } else if (key != CODED && key != ESC) { // Append valid typed characters to our outgoing string outString += key; }}// Automatically runs when incoming data hits a newline ('\n')void serialEvent(Serial myPort) { inString = myPort.readStringUntil('\n'); if (inString != null) { inString = trim(inString); // Clean up whitespace }}
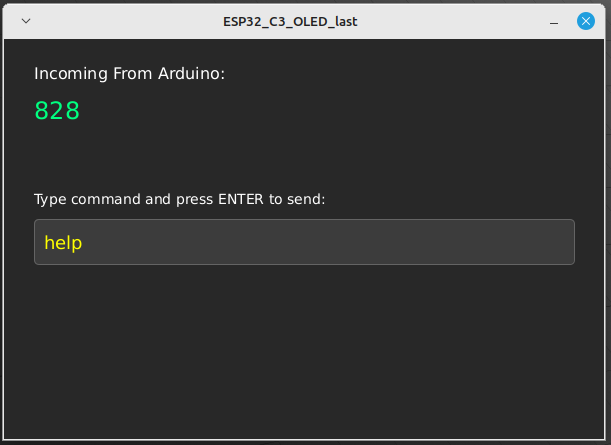
Fig. 2 Jag kan nu skicka kommandon till mikrokontrollern men t.ex. kommandot help producerar flera rader text vilket gör att jag endast ser den sista raden i appen ovan … vilket inte är till speciellt stor hjälp.
Programmeraren:
Make the incoming data area larger to fit the twenty last lines received from Arduino.
AI:
Here is the updated Processing sketch. It replaces the single-line display with a scrolling string array that stores and displays the last 20 lines received from the Arduino, formatting it like a classic terminal window.
import processing.serial.*;Serial myPort; // Create object from Serial classString[] lineHistory = new String[20]; // Array to store the last 20 linesString outString = ""; // Text being typed to send to ArduinoString lastSent = ""; // Remembers the last command sentPFont f; // Font for displaying textvoid setup() { size(700, 600); // Larger window size (width, height) to fit history // Initialize the history array with empty strings for (int i = 0; i < lineHistory.length; i++) { lineHistory[i] = ""; } // Print list of available serial ports to the console printArray(Serial.list()); // Open the port your Arduino is connected to String portName = Serial.list()[0]; // Change '0' if your Arduino is at a different index myPort = new Serial(this, portName, 9600); // Read bytes until a newline character ('\n') is received myPort.bufferUntil('\n'); f = createFont("Courier New", 14, true); // Monospace font fits terminal history best textFont(f);}void draw() { background(30); // Dark gray background // SECTION 1: Display Incoming Data History (Terminal Box) fill(255); textSize(14); text("Incoming From Arduino (Last 20 lines):", 30, 30); stroke(80); fill(15); rect(30, 45, 640, 410, 5); // Terminal history background box // Draw the 20 lines inside the terminal box fill(0, 255, 128); // Neon green for incoming data int startY = 65; // Vertical starting position for the first line int lineHeight = 20; // Space between lines for (int i = 0; i < lineHistory.length; i++) { text(lineHistory[i], 45, startY + (i * lineHeight)); } // SECTION 2: Input Field for Outgoing Commands stroke(100); fill(50); rect(30, 500, 640, 45, 5); // Draw the text input box fill(255); textSize(14); text("Type command and press ENTER to send:", 30, 485); // Display the text currently being typed inside the box fill(255, 255, 0); // Yellow text for typing text(outString + (frameCount % 30 < 15 ? "_" : ""), 45, 528); // Terminal-style blinking cursor // SECTION 3: Confirmation of last sent command if (!lastSent.equals("")) { fill(180); textSize(12); text("Last sent: \"" + lastSent + "\"", 30, 570); }}// Captures keyboard input for the command boxvoid keyPressed() { if (key == ENTER || key == RETURN) { // Send the typed string to the Arduino, adding a newline character myPort.write(outString + "\n"); lastSent = outString; // Save to display on screen outString = ""; // Clear the input field for the next command } else if (key == BACKSPACE) { // Remove the last character if backspace is pressed if (outString.length() > 0) { outString = outString.substring(0, outString.length() - 1); } } else if (key != CODED && key != ESC) { // Append valid typed characters to our outgoing string outString += key; }}// Automatically runs when incoming data hits a newline ('\n')void serialEvent(Serial myPort) { String inString = myPort.readStringUntil('\n'); if (inString != null) { inString = trim(inString); // Clean up whitespace and newlines // Shift all elements in history array up by 1 index for (int i = 0; i < lineHistory.length - 1; i++) { lineHistory[i] = lineHistory[i + 1]; } // Add the newest line to the very bottom of the array lineHistory[lineHistory.length - 1] = inString; }}
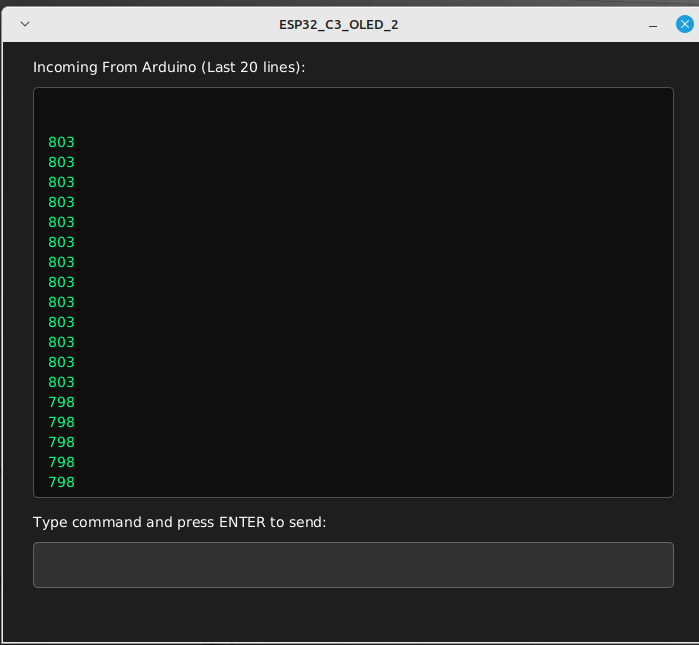
Fig. 3 De tjugo sista mätvärdena presenteras nu på PC-bildskärmen.
Resultatet är helt OK. Jag ser vad som händer nere på mikrokontrollern men det skulle vara trevligt med en grafisk display över mätvärdena. Det är lättare att med ett ögonkast se vad som händer i grafisk form än som en rad siffror.
Programmeraren:
Add a graphical display of single numerical values to the left of the scrolling text window. The size is 200×200 pixels. Scale the Y-axis 400-1500 and the X-axis as number of measurement with ticks 100 measurements apart.
AI:
Here is the updated Processing sketch. It expands the window to place a 200×200 pixel graph directly to the left of the terminal window.
The graph is designed to automatically parse incoming numeric text, plot it sequentially over time, and draw dynamic X-axis tick markers every 100 measurements. It also clips the plotted points to the exact requested 400 to 1500 Y-axis range.
import processing.serial.*;Serial myPort; String[] lineHistory = new String[20]; String outString = ""; String lastSent = ""; PFont f; // Graphing VariablesFloatList graphData; // Stores the history of numerical measurementsint graphX = 30; // Left edge of the 200x200 graphint graphY = 45; // Top edge of the 200x200 graphint graphW = 200; // Graph Widthint graphH = 200; // Graph Heightfloat minVal = 400; // Y-axis minimum scalefloat maxVal = 1500; // Y-axis maximum scalevoid setup() { size(930, 600); // Expanded width (700 + 230) to comfortably fit the graph on the left graphData = new FloatList(); for (int i = 0; i < lineHistory.length; i++) { lineHistory[i] = ""; } printArray(Serial.list()); String portName = Serial.list()[0]; myPort = new Serial(this, portName, 9600); myPort.bufferUntil('\n'); f = createFont("Courier New", 14, true); textFont(f);}void draw() { background(30); // ----------------------------------------------------------------- // SECTION 1: GRAPHICAL DISPLAY (200x200 Pixels) // ----------------------------------------------------------------- fill(255); textSize(14); text("Live Plot:", graphX, 30); // Draw Graph Grid Background stroke(80); fill(15); rect(graphX, graphY, graphW, graphH); // Draw Y-Axis Labels (400 to 1500) fill(150); textSize(10); textAlign(RIGHT, CENTER); text("1500", graphX - 5, graphY); text("950", graphX - 5, graphY + graphH/2); text("400", graphX - 5, graphY + graphH); textAlign(LEFT, BASELINE); // Reset alignment // Draw X-Axis Ticks (every 100 measurements) int totalMeasurements = graphData.size(); if (totalMeasurements > 0) { stroke(60); textSize(9); fill(120); // Find the first multiple of 100 visible in the current view window int startTick = (max(0, totalMeasurements - graphW) / 100) * 100; if (startTick < totalMeasurements - graphW) { startTick += 100; } for (int t = startTick; t <= totalMeasurements; t += 100) { // Map the measurement sequence number to the pixel X position int historyIndexFromRight = totalMeasurements - t; float tickPixelX = (graphX + graphW) - historyIndexFromRight; if (tickPixelX >= graphX && tickPixelX <= graphX + graphW) { line(tickPixelX, graphY, tickPixelX, graphY + graphH); // Gridline text(t, tickPixelX - 5, graphY + graphH + 12); // Measurement number label } } } // Plot the Data Line stroke(0, 255, 255); // Cyan color line for plot data strokeWeight(1.5); noFill(); beginShape(); // Display only the data that fits inside the 200px width limit int displayCount = min(graphData.size(), graphW); int startIndex = graphData.size() - displayCount; for (int i = 0; i < displayCount; i++) { float val = graphData.get(startIndex + i); // Constrain data values to the requested scale limits val = constrain(val, minVal, maxVal); // Convert numerical space (400-1500) to Pixel Space coordinates float plotX = graphX + i + (graphW - displayCount); float plotY = map(val, minVal, maxVal, graphY + graphH, graphY); vertex(plotX, plotY); } endShape(); strokeWeight(1); // Reset stroke weight // ----------------------------------------------------------------- // SECTION 2: SCROLLING TEXT WINDOW (Shifted to the right) // ----------------------------------------------------------------- int textWindowX = 260; // Pushed right to clear the 200px graph + margins fill(255); textSize(14); text("Incoming From Arduino (Last 20 lines):", textWindowX, 30); stroke(80); fill(15); rect(textWindowX, 45, 640, 410, 5); fill(0, 255, 128); int startY = 65; int lineHeight = 20; for (int i = 0; i < lineHistory.length; i++) { text(lineHistory[i], textWindowX + 15, startY + (i * lineHeight)); } // ----------------------------------------------------------------- // SECTION 3: INPUT FIELD & UTILITIES (Spans the bottom area) // ----------------------------------------------------------------- stroke(100); fill(50); rect(30, 500, 870, 45, 5); fill(255); textSize(14); text("Type command and press ENTER to send:", 30, 485); fill(255, 255, 0); text(outString + (frameCount % 30 < 15 ? "_" : ""), 45, 528); if (!lastSent.equals("")) { fill(180); textSize(12); text("Last sent: \"" + lastSent + "\"", 30, 570); }}void keyPressed() { if (key == ENTER || key == RETURN) { myPort.write(outString + "\n"); lastSent = outString; outString = ""; } else if (key == BACKSPACE) { if (outString.length() > 0) { outString = outString.substring(0, outString.length() - 1); } } else if (key != CODED && key != ESC) { outString += key; }}void serialEvent(Serial myPort) { String inString = myPort.readStringUntil('\n'); if (inString != null) { inString = trim(inString); // 1. Log Raw String to Console Feed for (int i = 0; i < lineHistory.length - 1; i++) { lineHistory[i] = lineHistory[i + 1]; } lineHistory[lineHistory.length - 1] = inString; // 2. Parse Numeric Value for Graphing try { float parsedValue = float(inString); if (!Float.isNaN(parsedValue)) { graphData.append(parsedValue); } } catch (Exception e) { // Keeps going safely if text lines contain alpha commands instead of integers } }}
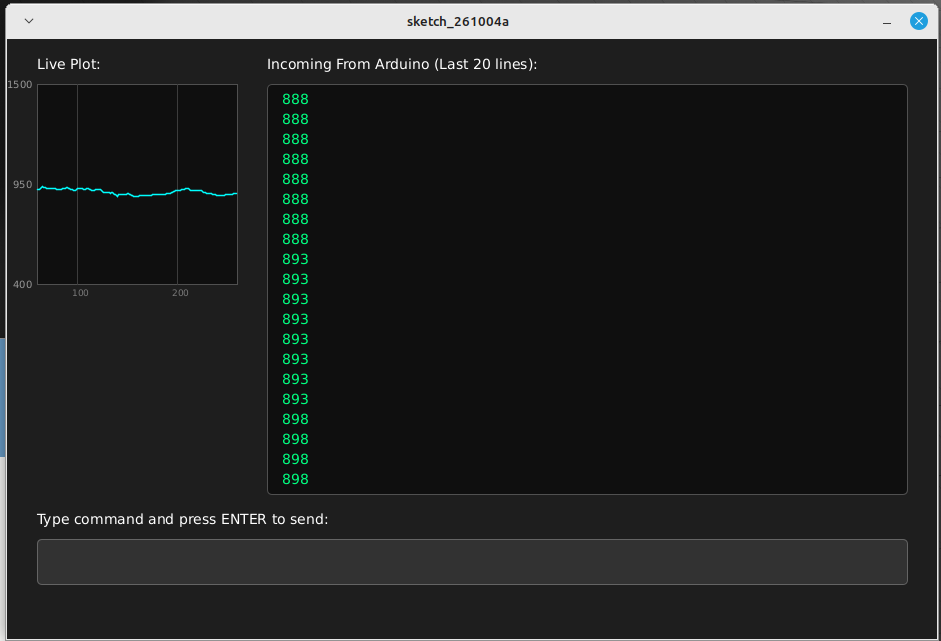
Fig. 4 Resultatet blev en app som kör under Linux, Windows och Mac som visar inkommande text från mikrokontrollern, tillåter mig att kontrollera mikrokontrollern med en serie kommandon samt visar en grafisk bild av CO2-nivån.
Notera! Jag producerade flera hundra rader kod för ett verktyg jag aldrig tidigare har använt utan att själv ha skrivit en enda rad kod. Total tid till den sista helt fungerande varianten var under femton minuter. Själva beskrivningen av vad jag gjorde krävde betydligt mera tid än själva ”kodandet”.
Min personliga uppfattning är att framtidens kodare är en person med en klar bild av vad hen vill ha och som är kapabel att i klartext ange det önskade resultatet. En typisk arbetsgång är att förbättra programmet i små steg, inte att försöka skriva en specifikation över många sidor. Varje steg testas innan följande detalj läggs till.

